
 The Democratic Party is showing why people all over the world fled socialism to experience freedom in America during the Cold War, except they are recreating that migration pattern within the continental United States.
The Covid pandemic has been a pretense for governors to implement heavy-handed policies that impact every aspect of residents’ lives without going through the normal processes of legislation. These controversial and divisive policies have included mask mandates, vaccine mandates, and ‘vaccine passports.’
The evidence is now in that authoritarian Covid policies have become extremely unpopular. Since the Covid pandemic policies began to really kick in back in July 2020, and until the data was accrued up to July 2021, Americans fled blue states. Meanwhile, states that banned vaccine mandates saw a surge in population in the aggregate.
A researcher laid out these migration patterns with charts that he posted on Twitter. It is posted in full below.
Presented in series of 10 charts/graphics + source list.
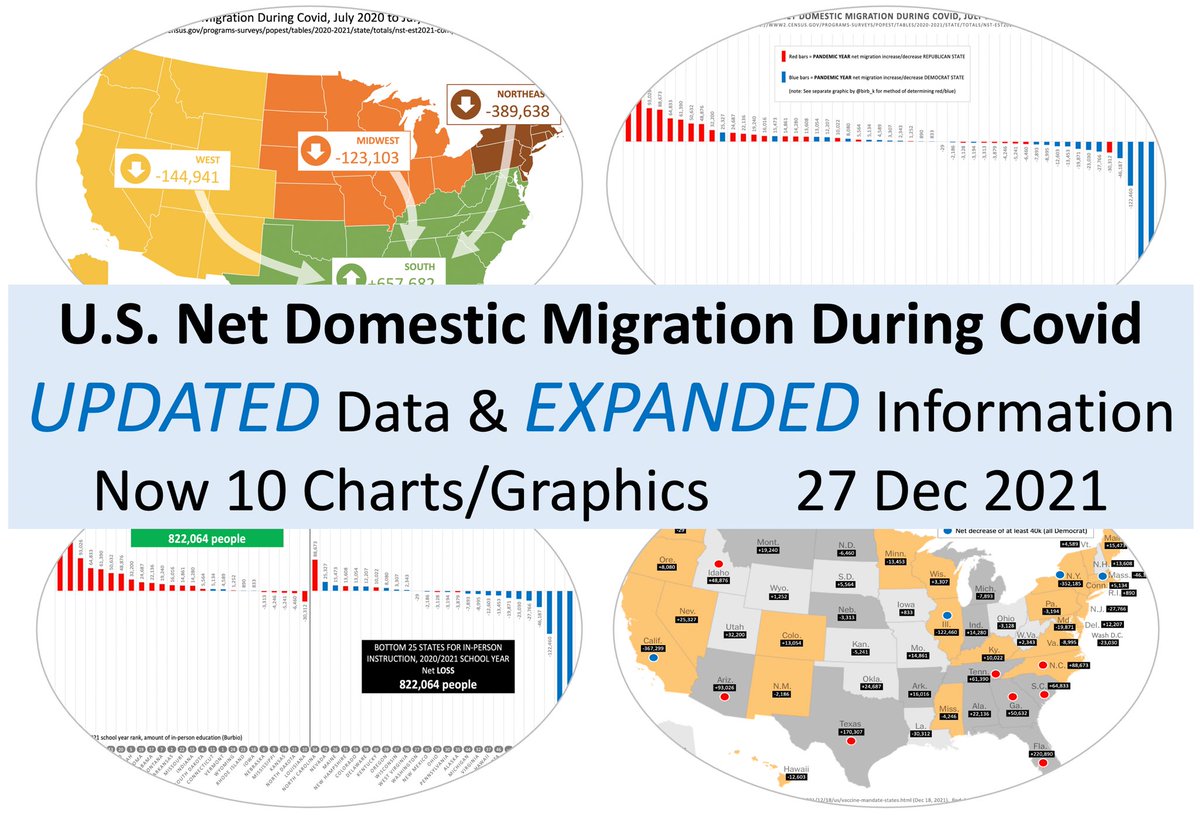
Chart 2/10. Net Domestic Migration Jul 2020 to Jul 2021, by the nine U.S. Census “Regions.” The three South Regions plus the Mountain Region are up, all others are down. Adding all nine numbers together equals zero, or a true “Net” migration, per Census design/analysis.
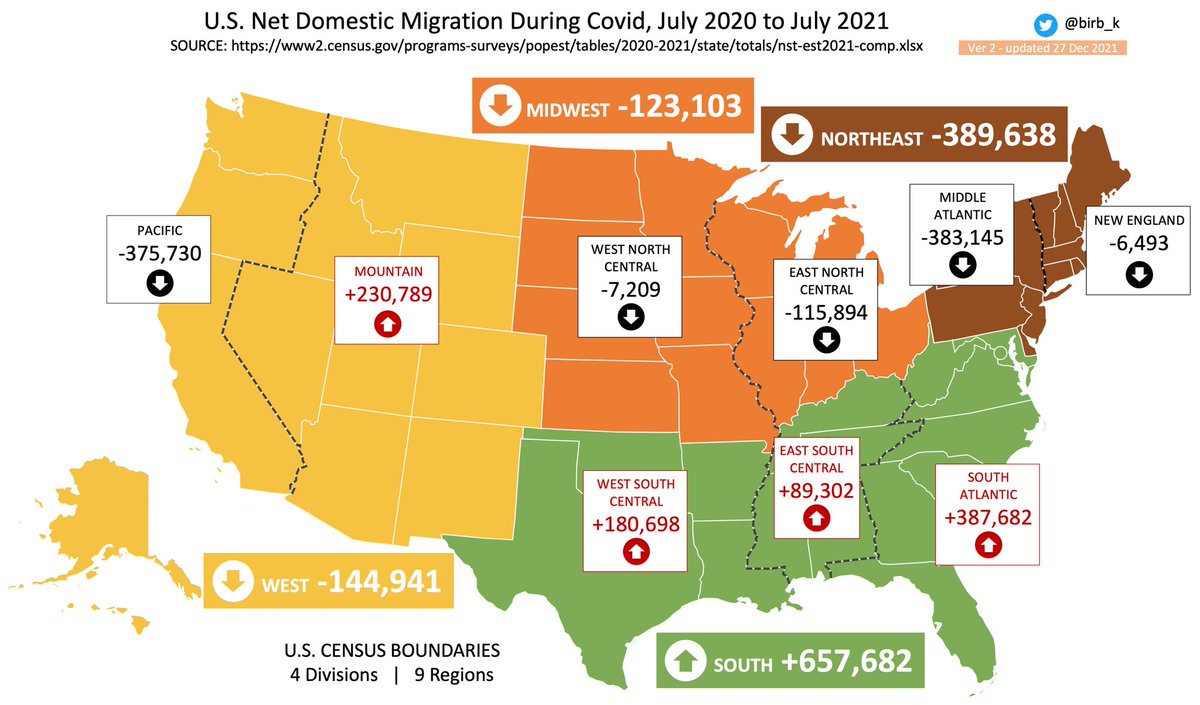
Chart 3/10. Net migration vs. vaccine mandates. 13 states that have banned/blocked mandates received net increase of nearly three-quarters of a million people. Conversely over 800K people no longer call states home that have vaccine mandates. Base map NYT. Black/blue/red mine.
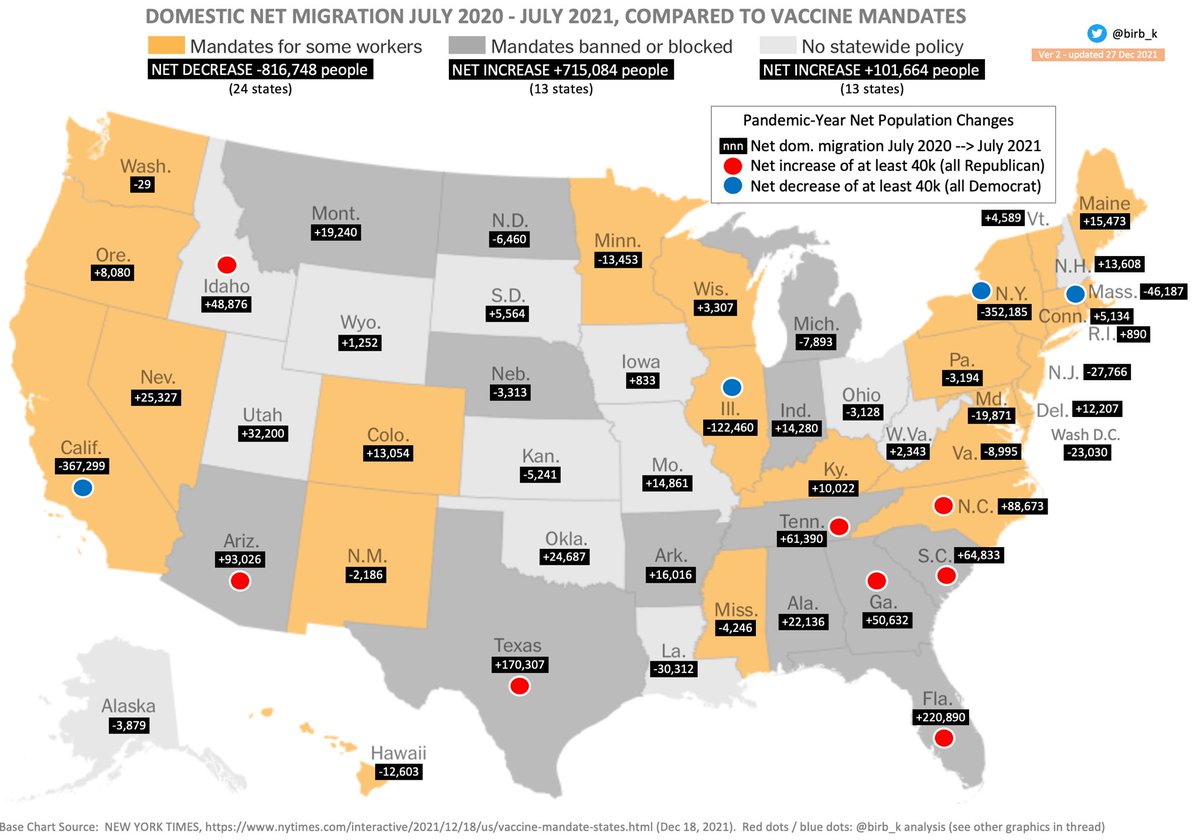
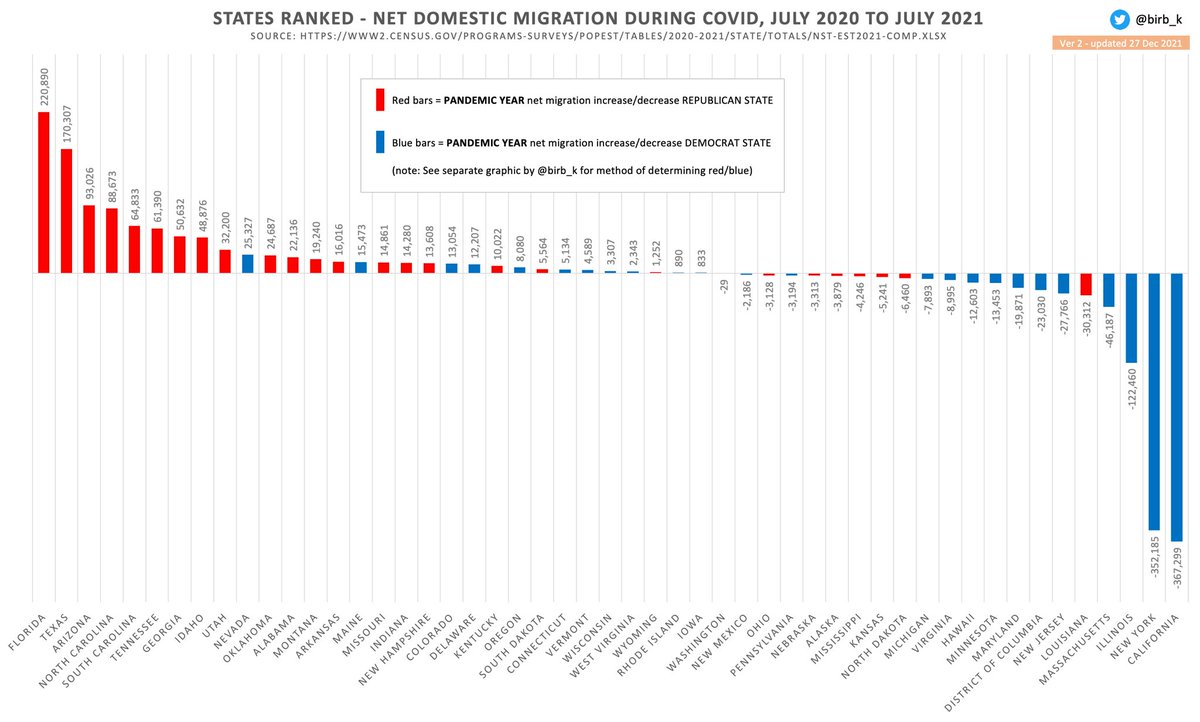
Chart 5/10. A couple claimed migration trend is typical and not Covid-related. This chart compares migration numbers to pre-Covid year July 2018 to July 2019. It shows that the trend does generally pre-date Covid, but Covid & Covid policies appear to be a massive accelerator.
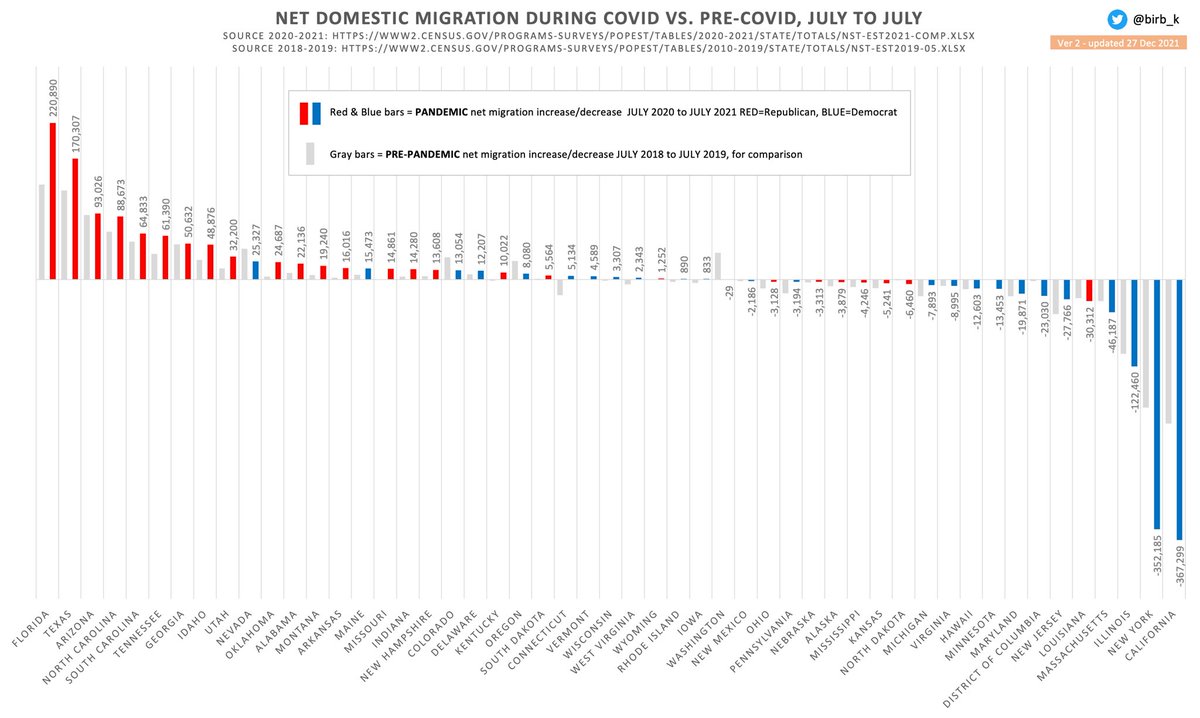
Chart 6/10. Digging back in time, this chart adds average annual migrations from 1995-2000. The migration trend from blue states to red states was evident even back then, but again Covid & Covid policies appear to have accelerated movement at a statistically significant scale.
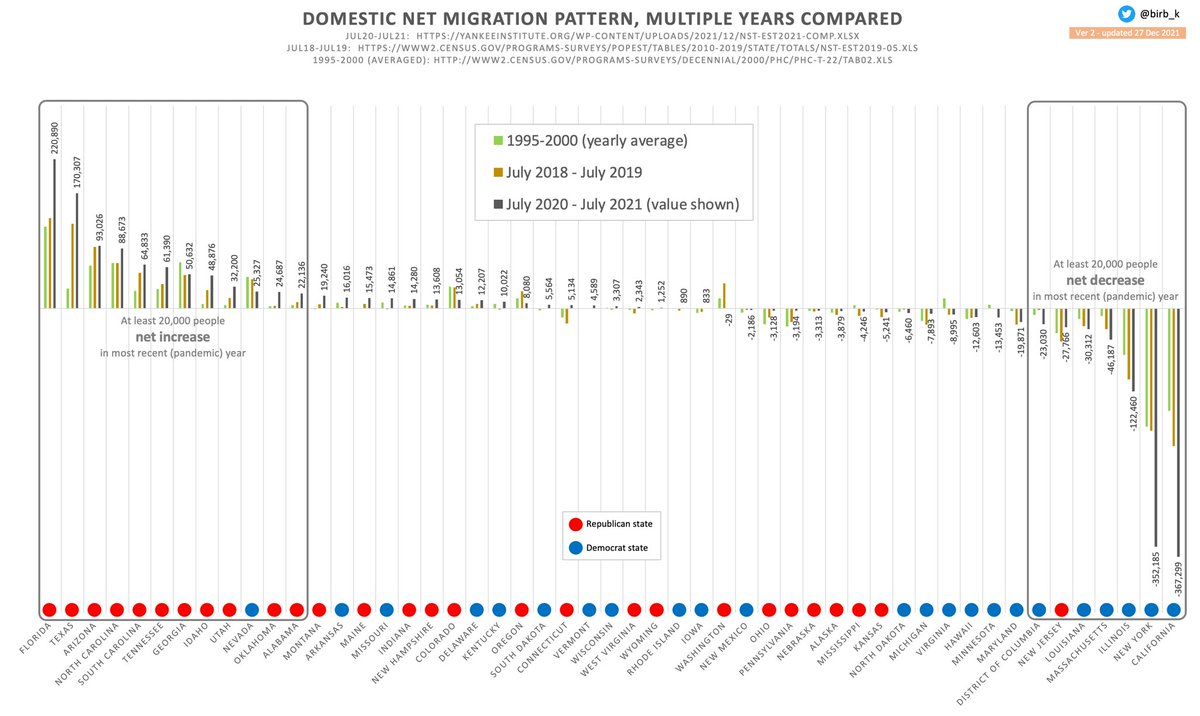
Chart 7/10. Migration by political party. On a net basis, nearly a million people who called Blue states home in early 2020, now call Red states home. CA, NY, IL biggest losses. FL, TX, AZ biggest gains. Red & blue determined by weighted scoring method, see chart 10.
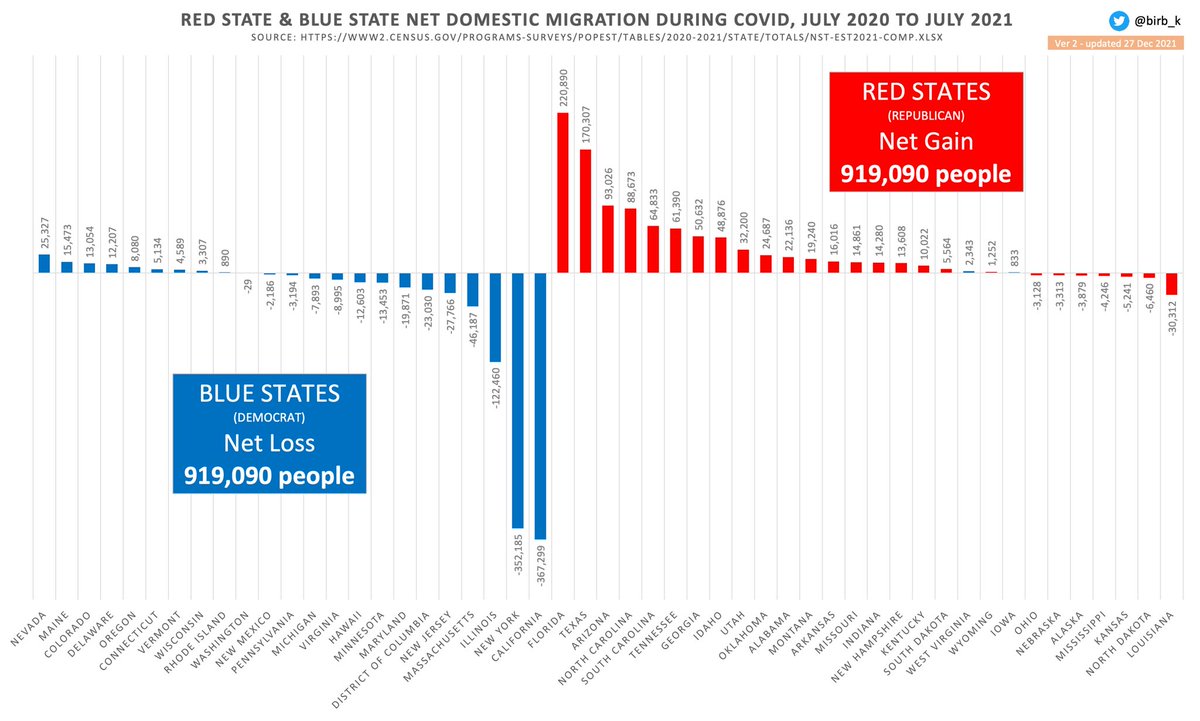
Chart 8/10. Public policy around child education appears to be a big influencer. Looking at the 25 states with most in-person education during 2020/2021 school year, vs the 25 states with lowest in-person education, reveals a net movement of over 800K people during Covid.
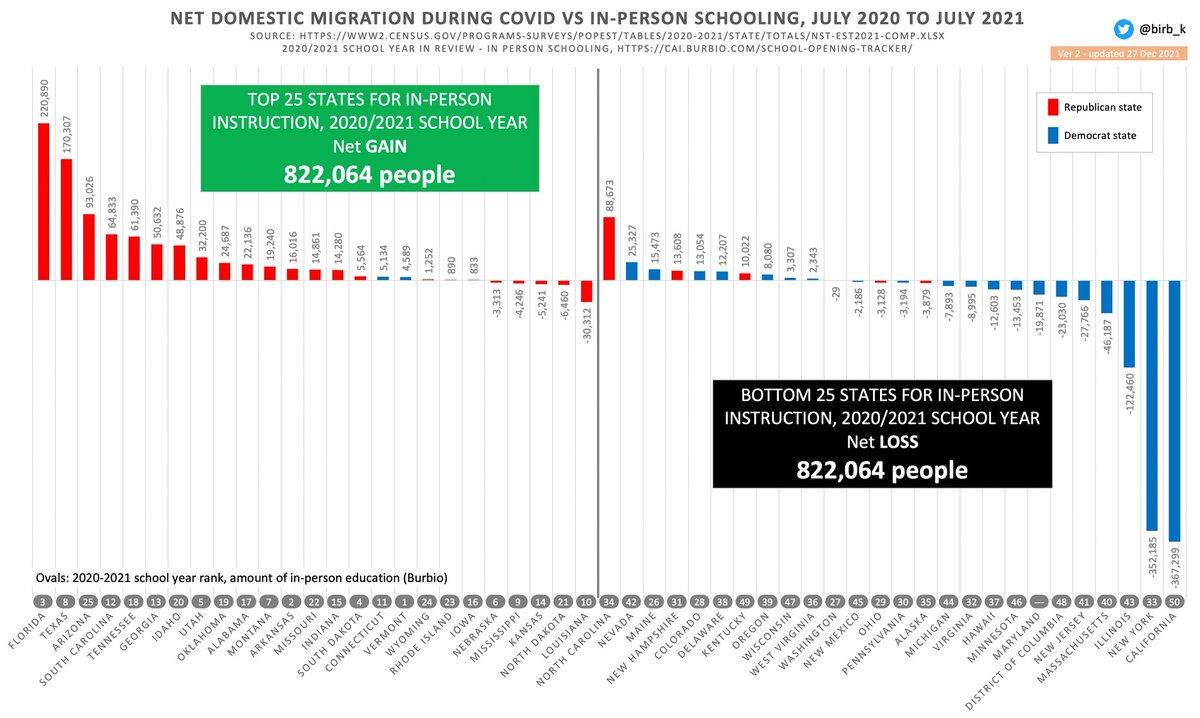
Chart 9/10. Per-capita migration is also revealing. Idaho hands down gainer at 2.73% of its previous pop, Montana 1.8% increase. Washington D.C. down 3.26%, New York down 1.81%. Illinois, California, and Hawaii down nearly a whole percent. Will such erosion continue?
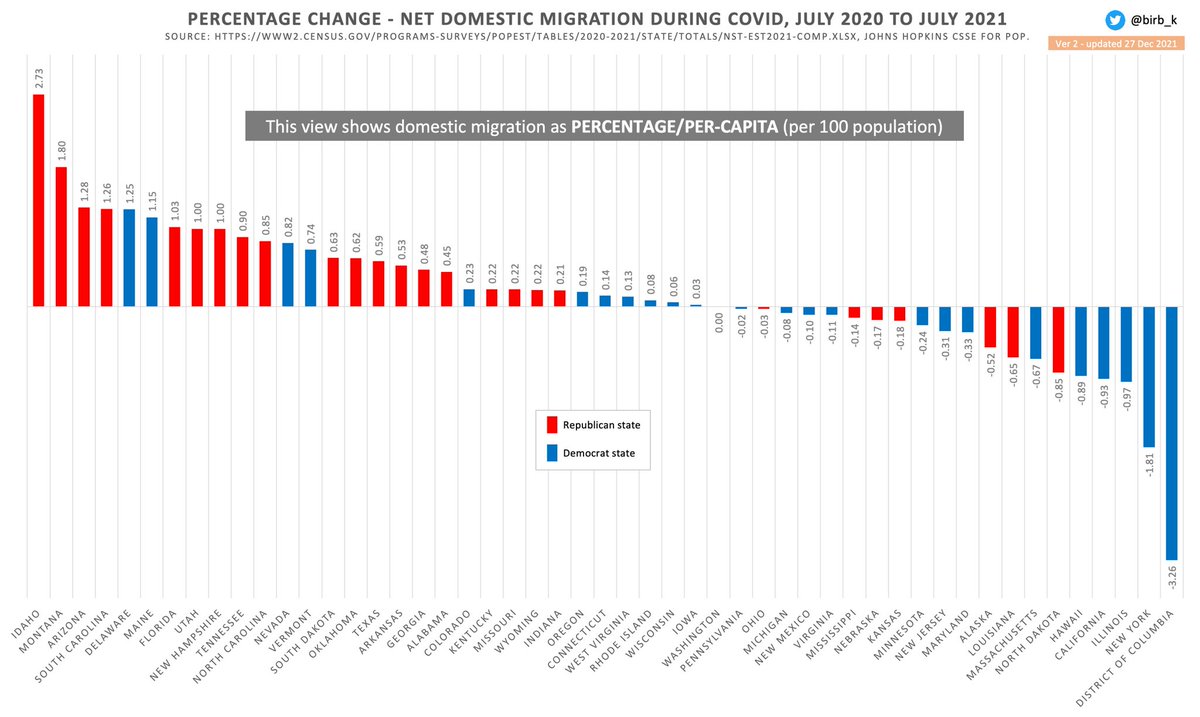
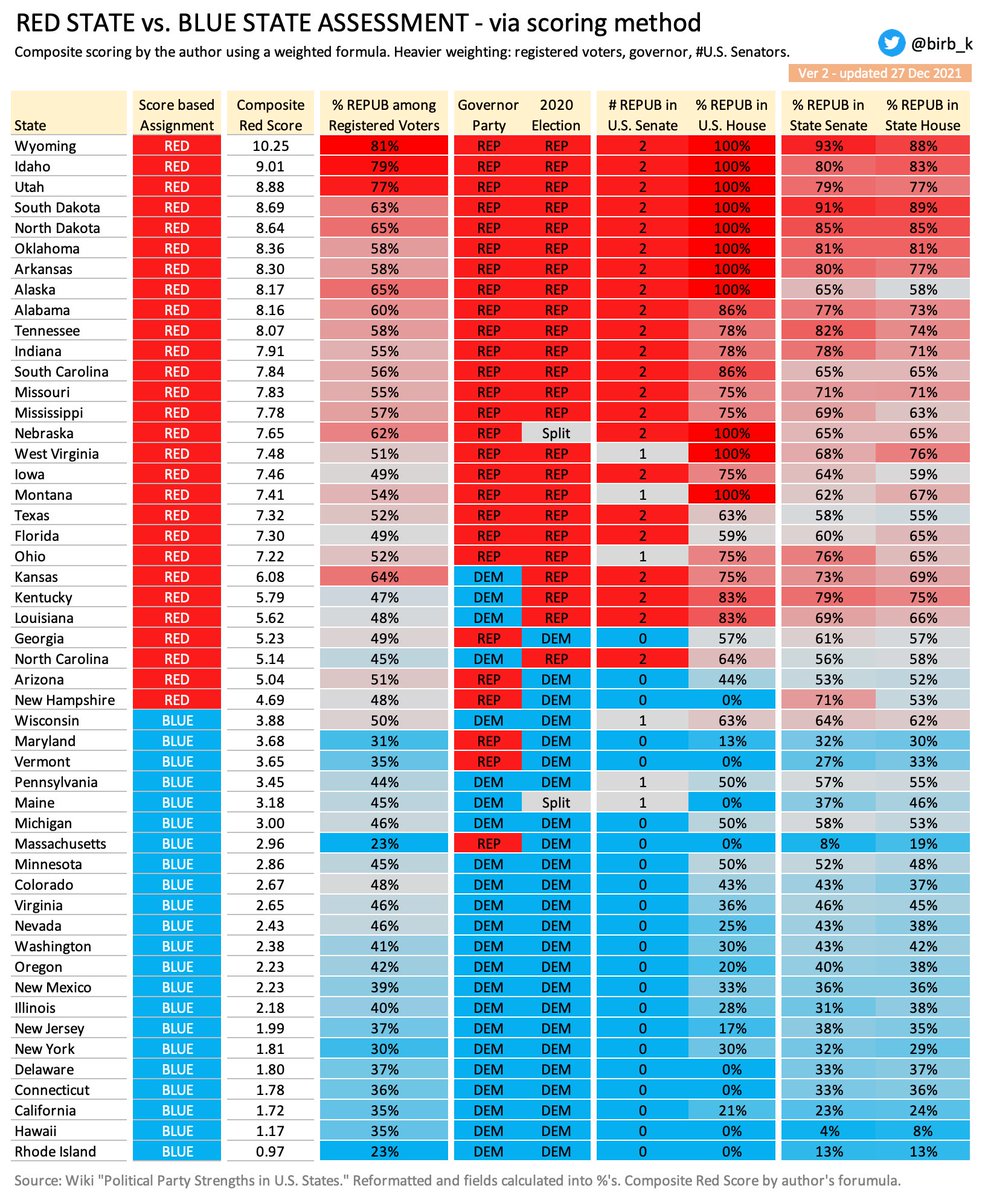
Chart 10/10. Identification of Red vs. Blue states was done using this admittedly imperfect homemade scoring system that takes in governor, registered voters, 2020 vote, and legislative representation at both the Federal & State level. Where nearly a tie, governor breaks tie.
The researcher, who goes by Kbirb, lists his sources here.
No wonder Democrats and health officials are pivoting on their Covid messaging, even as blue states maintain their mandates.
**By Kyle Becker
**Source